
What We Can Learn From Historic MOOC Data: Findings From Our Participation in the AIM Analytics Dropout Prediction Challenge
Rebecca M. Quintana, Learning Experience Designer
@rebquintana
Kyle Schulz, Data Scientist
Yuanru Tan, Learning Design and Accessibility Fellow
@YuanruTan
A team of three from the Office of Academic Innovation participated in—and won—the Academic Innovation at Michigan (AIM) Analytics Massive Open Online Course (MOOC) Dropout Prediction Challenge. Winning the competition was certainly a highlight of our experience, however, we feels we gained so much more!
This blog post details how two learning design researchers and a data scientist “joined forces” and combined methods from their respective fields to compete in the challenge. Through this process, we were able to enrich our mutual understanding of learning design and data science, and gain insight into how the two approaches can synergistically work together.
Motivations
Yuanru Tan, Learning Design and Accessibility Fellow, and Rebecca Quintana, Learning Experience Designer, wanted to learn how data scientists approach learning analytics problems, such as identifying which learners are at risk for not completing a course, in order to make improvements in the design of a course. Kyle Schulz, Data Scientist, also signed up for the AIM Analytics challenge; he had the goal of mapping his previous predictive analytics experience onto a new domain (online courses) in order to both learn more about the subject space and compete for the prize money.
The Challenge
The primary goal of the challenge centered on online learners and their persistence within online courses offered on the Coursera platform. In the bulk of these offerings, the percentage of students who remain active throughout the duration of the course is only a small percentage of the total enrollment population. For the competition, participants were provided with the first four weeks of learner data from a random subset of the courses and asked to predict a probability of persistence (defined as showing any activity during the last week of the course) for each learner in the course.
Goals
Early in the competition, we decided to join forces, with two mutually beneficial goals in mind:
- (1) to understand what can be learned about the evolution of course design from historic MOOC data and
- (2) to develop a model with the purpose of discovering which learner behaviors have significant effects on course persistence rates.
In addition, we wanted the opportunity to work together, as we saw great potential to learn from each other and to draw insights from each others’ disciplines.
Learning design
According to Conole (2010), “‘Learning design’ is an all encompassing term to cover the process, representation, sharing and evaluation of designs from lower level activities right up to whole curriculum level designs.” A particular thrust of this discipline is to make the process of designing learning activities and resources more explicit and shareable. Learning Designers seek to develop a range of methods and tools that will result in design representations that capture aspects of designed curricula, such as learning objectives, activities, assessments, and outcomes, in the form of design representations (e.g., diagrams and charts).
Data Science
Data Scientists who work in the field of learning analytics engage in the measurement, collection, analysis, and reporting of data about learners and their contexts, for the purposes of understanding and optimizing learning and the environments in which it occurs (LAK, 2011). While the power to seemingly gain insights into events which have yet to occur can seem pretty “cool,” it’s the ability to learn from said insights and help prevent negative outcomes from occurring in the first place that transforms data science from an entertaining trick to a revolutionary field.
Process and Outcomes
We used log, clickstream, and demographic data from a University of Michigan MOOC on Social Network Analysis (SNA) and an unpublished instance of the course on a MOOC platform to meet our goals. To understand how course design may have evolved (and thus how learner behavior might differ), we also studied the design the two SNA courses. One was the Applied Social Network Analysis in Python which launched on Coursera in 2017. As one of the five courses in the Applied Data Science in Python specialization, this intermediate level course introduces learners to network analysis through tutorials using the NetworkX library. Another course was Social Network Analysis which uses both the theory and computational tools in social network analysis to make sense of the social and information networks that have been fueled and rendered accessible by the internet.
Learning Design Approach and Outcomes
Yuanru and Rebecca used a method for visualizing course structure (Quintana, Tan, & Korf, 2018; Seaton, 2016) to compare a historic SNA MOOC with a contemporary SNA MOOC.
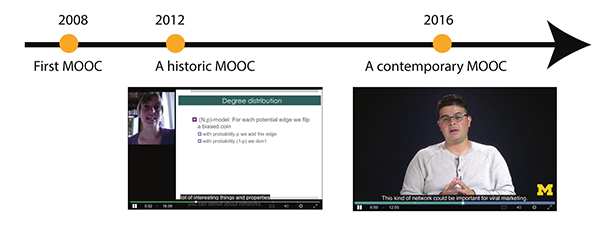
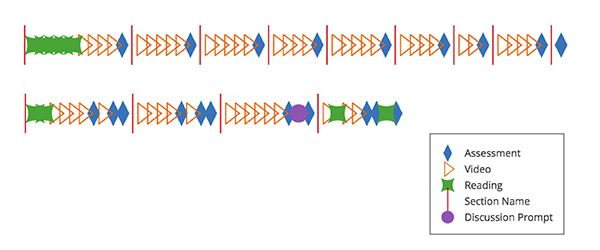
These two course “snapshots” provided us with insights into how course design and production styles have evolved over the past several years at the University of Michigan. Although MOOCs are a recent instructional form (with the first MOOCs emerging around 2008), their design has evolved rapidly throughout the past 10 years.
Our comparison revealed two aspects of the temporal evolution of MOOC design:
Video production styles: Social Network Analysis tended to have longer videos, ranging in length from 15-25 minutes, while Applied Social Network Analysis in Python had much shorter videos ranging from 7-12 minutes. In terms of formality, at U-M, we have moved away from a more informal style, with an instructor lecturing from various locations around campus, to a more standard mode where the instructor is filmed in a studio setting.
Commitment required by learners: Social Network Analysis required learners to acquire and use software that was external to the platform and use their own personal data within assignments. Applied Social Network Analysis in Python provided data and software on platform, thereby lowering the barriers to participation. Also, the overall length of MOOCs has changed, with the historic MOOC lasting for nine weeks and the contemporary version lasting for only four weeks.
Learning Analytics Approach and Outcomes
Before embarking on the task of training the model, we reviewed recent learning analytics research on student behaviors and their associations with MOOC outcomes. For instance, Gardner and Brooks (2018) found clickstream-based data, such as number of days for which user registered any clickstream activity, is one of the most effective predictors in the models they reviewed. Guided by the literature and by what we learned from our preliminary analysis, we engaged in a brainstorming activity to propose additional features that could be complementary to previously established persistence factors.
Equipped with a new arsenal of feature vectors, we implemented a gradient boosting algorithm (XGBoost) to allow us to analyze:
- The overall accuracy of our persistence prediction,
- The performance of our prediction method relative to other published models,
- and the relative feature importance for all of the features in our final model.
Of the features we implemented, the two most powerful predictors were:
- (1) The timestamp of a learner’s last “interaction” with the platform (i.e., their last click) and
- (2) The timestamp of the last “in video” quiz submission.
Although we didn’t discover any groundbreaking new persistence factors, our final model was first place in the contest!
“The process for training an algorithm was less intuitive than I thought it would be. I assumed that we could use what we had learned through our learning design research to inform our decisions about what factors would be most predictive of learner persistence. It turns out that isn’t the case at all!” – Rebecca M. Quintana, Learning Experience Designer
“Seeing the way the learning design team approached a new dataset allowed me to gain valuable knowledge in attempting to understand a machine learning problem. After spending so much time seeing everything in a number-dominated view, it was fun to explore a MOOC from the course design perspective!” – Kyle Schulz, Data Scientist
“Working on this project with Kyle and Rebecca really opened a new window for me to look at the job of content creators. By participating in this learning analytics project, I learned that learners’ engagement is not always a story around content; designing engaging content is far more intriguing than I would think!” – Yuanru Tan, Learning Design and Accessibility Fellow
References
Conole, G. (2010). An overview of design representations. In Proceedings of the 7th International Conference on Networked Learning (p. 482-489).
Gardner, J., & Brooks, C. (2018). Dropout model evaluation in MOOCs. CoRR, abs/1802.06009.
Learning Analytics & Knowledge (2011). Retrieved from https://tekri.athabascau.ca/analytics/
Quintana, R. M., Tan, Y., & Korf. N. (2018). Visualizing course structure: using course composition diagrams to reflect on design. Paper presented at the Annual Meeting of the American Educational Research Association (AERA). April 13-17. New York, New York.
Seaton, D. (2016). Exploring course structure at HarvardX: a new year’s resolution for MOOC research. Retrieved from https://vpal.harvard.edu/blog/exploring-course-structure-harvardx-new-year%E2%80%99s-resolution-mooc-research

