Stephanie Haley, Product Manager, Strategic Initiatives
Elizabeth Hanley, Post Graduate Data Science Fellow
Caitlin Holman, Associate Director, Research and Development
@chcholman
“Retired. Needed something to do,” writes one of the learners in the popular online Programming for Everybody course when asked why they enrolled in that particular course. “Interested for the sake of it,” writes another. Collected in a repository of free-text survey data brimming with learner reasons for enrolling in this and other Massive Open Online Courses (MOOCs) hosted by the University of Michigan, here are voices that seem at home among the many learners who report enrolling for fun, as a hobby, or out of curiosity for the subject.
While taking a course for fun or curiosity is certainly not mutually exclusive with the desire to fully complete the course and earn a certification, there is something in these responses that reads like a clue for reframing how we talk about the low completion rate that has been prevalent in MOOCs since their inception in 2012. Alongside learners who enroll in MOOCs with a discrete goal — to finish the course — is a set of students for whom success might not necessarily look like course completion.
One of the challenges in unpacking the nuances of learner success outside the framework of course completion, though, is that it quickly becomes complex to quantify whether or not the needs of different groups of learners are being met. This January, a group of us at Academic Innovation set out to tackle that complexity by finding a more nuanced way of illustrating how groups of learners with varied goals and backgrounds are interacting with MOOCs at the University of Michigan.
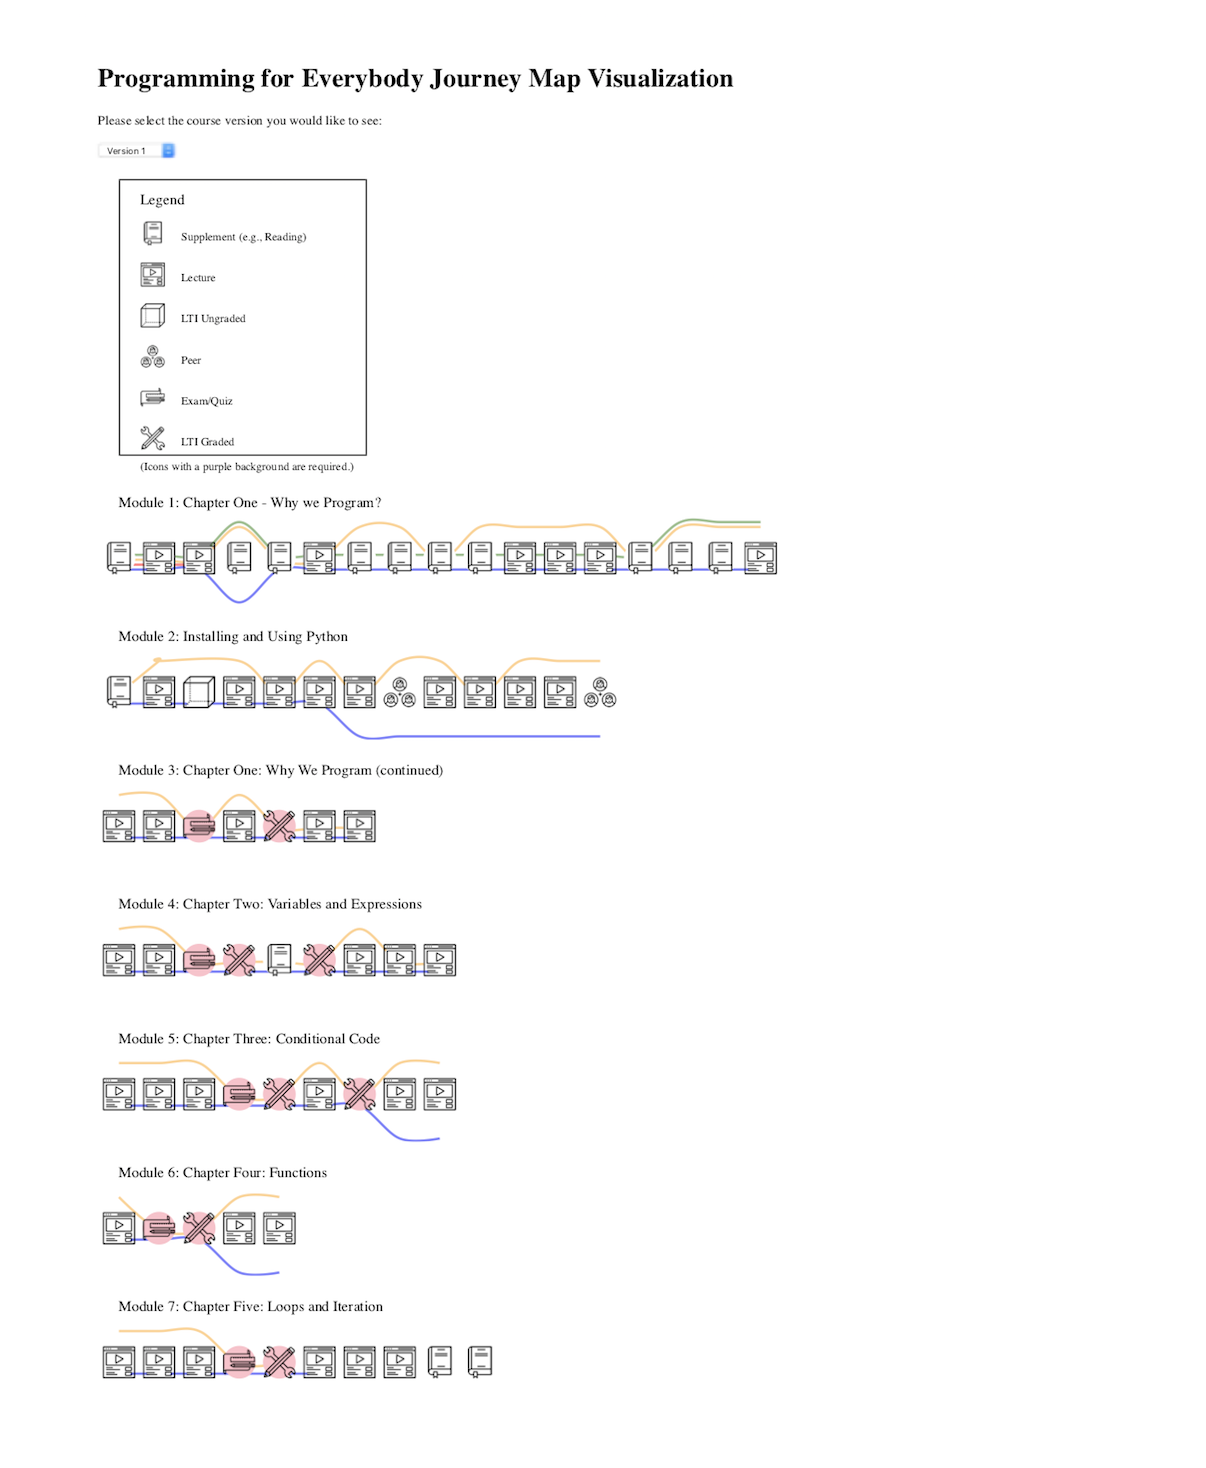 Enter the Course Journey Map, a tool for visually representing student interactions with course items much the same way we might represent stops on a subway map. If each course item is represented as a stop, a journey map allows us to tangibly trace the movements of different learners as they interact with, or skip, each item. When we zoom out, we have an illustration of student engagement patterns throughout the course.
The Course Journey Map evolved out of the concept of a journey map, a tool that is utilized in the human-centered design process to visually tell the story of a user’s journey through an experience and/or product. Journey maps provide a shared foundation for conversations around user experience that designers and developers can use to identify and brainstorm around needs, pain points, and opportunities.
At Academic Innovation, we took a data-driven approach to journey mapping, first establishing learner group archetypes via a machine learning clustering technique. At first, using this strategy to establish learner archetypes felt like a gamble. After all, the algorithm we used is referred to in the machine learning world as unsupervised, meaning that there was minimal human input to guide the algorithm in sorting learners based on their patterns of completing various course items.
Would this algorithm, which was blind to learner motivations and demographics, be able to sort learners into meaningful groups based solely on how they move through the course? Essentially, we were betting that learner needs were distinct enough within an online course that we could identify different learners from the bottom up.
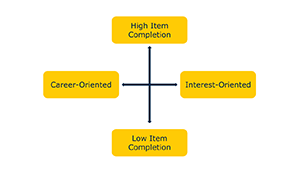
As it turns out, learner clusters coalesced into such distinct groups that when we mapped learner motivations and demographics back onto the cluster groups, we were left with an unmistakable taxonomy of learners. In the Programming for Everybody course, for example, we discovered four interrelated learner groups.
To start, there were those who told us they were primarily career-oriented and wanted to complete a certification. Then there were those who were primarily interest-oriented, taking the course just because they wanted to. Under each of those umbrellas were two groups: those who completed most of the course items, and those who completed only a few.
 The four groups in Programming for Everybody moved through the course in strikingly different ways. Those who were career-oriented focused on completing graded assignments, which were required for earning a certification. On the other hand, those who were more interest-oriented tended to interact with a broader range of assignments regardless of whether or not the items were required for passing the course. Of those who completed few assignments overall, the interest-oriented group made it further into the course than those who were seeking a certification.
Returning to the subway metaphor, our journey mapping process helps us understand learner success in terms of an actual journey. While there may ultimately be a destination in mind, different learners have different needs and interests along the way. Some learners want to reach a given destination as fast as possible, stopping only when necessary. Others prefer to take their time, stopping at every landmark of interest. Some are explorers who may not even have a destination in mind; they just want to see what’s out there.
If we think about a course in these terms, success becomes more about meeting learner’s individual goals than ensuring course completion for every learner. In our case, journey mapping ultimately reaffirms what the learner voices above have been telling us: Not all learners are here for the same thing.
The next step for our Course Journey Maps is to speak directly with these different learner voices. We are reaching out to learners from each cluster to hear about their experiences. Using what we learn from these interviews, we will then build out different learner archetypes for each group depicting characteristics like their goals, how they perceived success in their learning, and how that impacted their approach to engaging with the course material. Keep your eye out for a blog post later this summer describing our findings from the next step in developing the Course Journey Maps.