Cait Holman, PhD, Associate Director of Research & Development
@chcholman
Liz Hanley, Data Science Postgraduate Fellow
Kyle Schulz, Data Scientist
@kwschulz_um
Priya Shanmugasundaram, Data Science Fellow
Instructors and teaching assistants can’t know every detail of what is happening in a class to assess whether a group of students is on track to success, especially in large classes. Everything from assigning students to groups, to helping students and instructors keep track of challenges and progress, to figuring out when different pieces of content are most helpful in the semester becomes difficult when large class sizes are in the mix. This is where Tandem shines as a way to support teamwork among students.
A few weeks ago our Tandem faculty co-founders from the College of Engineering, Laura K. Alford, PhD, Lecturer in Naval Architecture and Marine Engineering, Robin Fowler, PhD, Lecturer in Technical Communications, and Stephanie Sheffield, PhD, Lecturer in Program in Technical Communication, wrote about their motivations for creating Tandem and the importance of team-based work as part of learning. I encourage you to go read their piece to learn more about the inspiring work by this team. In this post, we want to talk about how the Research & Development team at the Center for Academic Innovation has been supporting Tandem’s growth through data analysis. Tandem is the first piece of software for which the R&D team has been able to do ongoing, weekly data work to support the formative design decisions that face all new technologies, and it’s been so much fun to be part of its growth.
Our student fellows, Brandon Punturo (Summer 2018-Winter 2019) and Priya Shanmugasundaram (Summer 2019), mentored by Kyle Schulz and Liz Hanley, have done stellar work this year processing the steady stream of very different types of data that were created throughout Tandem’s first semester. Since we’ve only collected one semester of data, we can’t share results in a way that doesn’t reveal student identities. Nonetheless, we can talk about the processes we’ve used thus far and what we’re looking to explore next.
Who should work together?
Assigning students to groups is the first place data have the potential to play a role, and often does. There are three basic ways (and many, many variations) that group selection tends to play out: 1) randomly (think of pulling group numbers out of a hat), 2) student-selected (find your friends!), or 3) instructor-selected (often based on data collected via a survey). Common things that instructors consider here include workstyle (are you someone who gets things done early or do you work right up until the deadline?), topic of interest, skillset, and logistical constraints (where do you live, when are you available to meet, etc). The question then becomes, What combinations of people make for a productive team?
Maximizing alignment among team members’ interests while minimizing logistical issues both feel like obvious wins – but they often conflict. Which do you prioritize? What do you do with outliers, students who don’t easily fit into a group based on the questions they were asked? Instructors have been navigating these tradeoffs for a long time, but as we consider whether or not to build a group-creation feature in Tandem, we get to think through how the information that we know about students at the beginning of the semester correlates with their experience in the course in a very detailed way. As the application scales to support many classrooms in different domains, with different levels of content, and different pedagogies in play, we’re very curious to understand which of our observations from this semester will become patterns that sustain, and in which contexts.
Helping instructors and students be aware of issues and progress
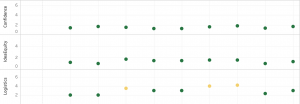
For Tandem to be successful at its goal of helping students navigate team issues, we need a way to identify which teams are currently experiencing challenges and which teams are likely to in the future. Each week, we ask students to rate their team in Tandem: Is the distribution of work fair? Do they think their project is heading toward success? Are they having logistical issues? Brandon and Kyle created a series of visualizations of these responses to help us keep track of the groups’ reports week-by-week. We used these to reflect on 1) whether team members were collectively reporting issues and 2) whether or not there was agreement between teammates.

There are so many interesting questions here that drive the design of the application. Do groups where the majority of team members know that they are struggling tend to be able to course-correct? If so, then a primary goal for Tandem might be to help inform team members that their colleagues are concerned. On the other hand, unified reporting of an issue might be an indicator that the team has essentially given up and will struggle to recover. Through collecting this data weekly and then connecting it to the grade data, we can begin to see patterns and make recommendations for how, and when, to intervene.
With the entire semester of data in hand, Priya spent the summer making sense of the holistic picture. We used clustering techniques to identify patterns in the types of students observed in the class and then explored how those related to group cohesion and performance. As we deploy Tandem in three classes this fall (more to come on that soon), we’ll use the processes Priya built to assess whether we see new patterns emerge with a larger population and in very different course contexts.


