Kara Foley, MOOC Assessment Fellow, University of Michigan Ross MBA and M.A. Educational Studies
Eejain Huang, Data Visualization Fellow, Combined Program in Education and Psychology, Statistics
@eejainh
Filip Jankovic, Research Assistant & Data Science Course Coordinator, MSE Industrial and Operations Engineering
Why Data Visualization?
In the virtual world, learners’ background and needs are assumed and indistinct, creating one of the biggest challenges for massive online courses: finding out who the learners are.
Here at the Digital Education and Innovation Lab (DEIL), we have devoted a lot of time and resources into developing effective initiatives to transform education. As an essential element in this process, collecting and interpreting learner feedback is at both the beginning and end of every MOOC course.
 Three surveys were designed with iteration, assessment, research and marketing needs in mind. However, useful information is often hidden from decision makers because of the considerable amount of data gathered from these surveys.
To better explore this large amount of survey data, understand our learners and adapt courses according to their needs and feedback, DEIL created the DEIL Data Team to tackle these issues.
Data visualization was chosen as an ideal approach to interpret big data based on several reasons. First, data visualization can serve as a summarization, a guidance, a metaphor and eventually a gateway to understanding data. Second, data visualization can convey learning analytics in a digestible, actionable format for the audience. Like the old proverb says, “sometimes a picture is worth a thousand words.”
Who We Are and Our Journey
Our team has three members from diverse backgrounds who have contributed different expertise. Eejain Huang is a Ph.D. candidate working in Combined Program in Education and Psychology as well as a masters degree in statistics. Filip Jankovic is a U-M graduate with a Master of Science and Engineering degree in Industrial and Operations Engineering and is currently working with Dr. Christopher Brooks on the Applied Data Science with Python Coursera Specialization. Kara Foley is a recent graduate and has obtained her Master of Business Administration degree and Master of Arts degree in Educational Studies.
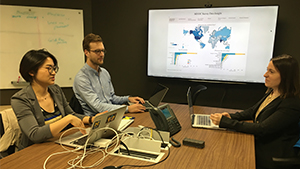 Kara was hired as a MOOC Assessment Fellow in January 2016 to evaluate which data visualization tool(s) would both be feasible to implement and highly automated. With input from additional faculty and staff across the University, we opted to reformat and clean the data using R and construct the visualizations in Tableau. Kara created initial prototypes of dashboards, and saw the challenges of data manipulation and advanced visualization design that needed to be addressed by a larger team with additional skills.
Eejain then began her full-time role in the summer of 2016 to clean the data and reshape it into a format that could be used to create Tableau visualizations. Much work had been spent on optimizing data structures to accelerate processing time, cleaning text responses with regular expressions and creating unique identifiers to link different surveys.
Finally, when the data was ready for creating and refining the visualizations using Tableau, Eejain created the Tableau dashboard. Filip joined our team in August of 2016 bringing with him his expertise in data science guiding best practices for visualization design. Filip helped ensure the visualizations represented the data accurately and effectively – an essential step when creating dashboards that allow decision makers to make well-informed decisions.
As dashboard revisions were made, we shared the visualizations with faculty and staff for their feedback. This involved hosting multiple meetings with different teams within the Office of Academic Innovation, and also conducting individual interviews with people who have specialized expertise in different steps of shaping a MOOC course including Dr. Christopher Brooks, Laura Elgas, Dr. Gautam Kaul, Noni Korf, David Lawrence-Lupton and Dr. Donald Peurach. Through this process we have learned about main priorities, key data points of interest and potential implications of this data.
What Did We Find and Some Insights
Currently, we are still experimenting on different ways to represent data and are seeking the best ways to distribute our findings. However, even at this transitioning stage, we think our findings may serve as an insightful guide for understanding learners and transforming MOOCs.
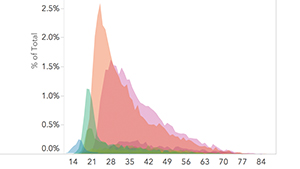
Although we recognize that our sample size is a small percentage of our learners, we discovered some trends that instructors may find useful for course design. While the majority of our respondents come from the United States and self-identified as Caucasian/ European / Russian, learners from developing countries constitute the next largest proportion of respondents. We noticed a difference in gender participation in our MOOCs, and in higher education degree attainment. Gender was a factor as well in self-ratings regarding confidence levels for language and use of technology. Regarding degree levels, these played an important role in influencing learners’ choice about participating in a course, their expectations about the course and their motivation for participating.
When looking at the dashboard, we found that many of the demographics and student feedback changed from course to course. This view can provide important insights to instructors to help them better understand their learners.
In conclusion, our findings showcased how diverse our learner community is and how different their needs can be. Nationality, ethnicity, gender, educational background and prior experience etc., all contribute to their expectations of, and experience during, the course. Thus, we hope our visualization can help course designers understand who their audience is, what they want, as well as how to make their content more accessible and eventually create a more targeted, personalized and engaged experience for every learner around the globe.
Faculty who are interested in learning more about MOOC survey data may reach out to the Office of Academic Innovation directly at [email protected]
