Ning Wang, Fall/Winter Innovation Advocacy Fellow
@nwangsto
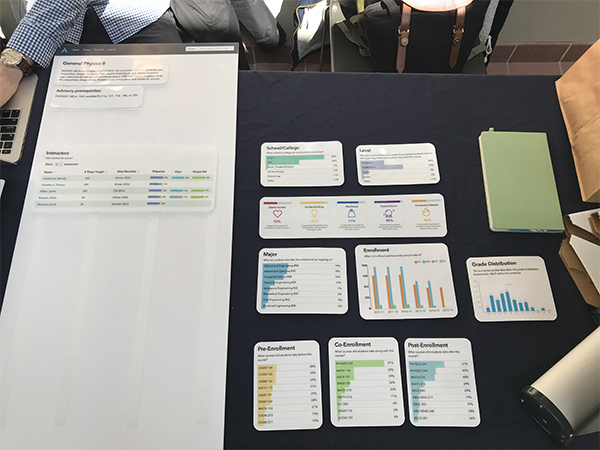
At the Office of Academic Innovation, we improve our digital tools through feedback from students and users, and as a former Innovation Advocacy Fellow at Academic Innovation, my work focused on helping to initiate innovative forms of usability tests. In this blog post, I will talk about one form of usability testing we’ve conducted in the past and how it is a valuable means to collect feedback for both informing iterative improvements to our digital tools. (Figure 1: Pop-up test on north campus)
What are “Pop-up” tests and what advantages do they provide?

“Pop-up” tests are an experimental form of usability testing that I worked on from an initial stage during my time with Academic Innovation. Unlike traditional forms – such as one-on-one interviews, focus groups etc. – “pop-up” tests free us from the constraints of small, enclosed meeting spaces and a traditional Q&A format. Instead, these tests allow researchers to interact with students during their daily routine to encourage more interaction between participants and interviewers. Advantages of this type of activity include gathering quick feedback from a larger and wider student body in a short period of time, making more students and faculty aware of digital tools developed by Academic Innovation, and ample opportunity to collect feedback. Through these tests we realized the activities used to gather feedback are not confined by rigorous interviews. Due to the flexibility of the environment in these “pop-up” tests, we can actually have participants transition their roles from passive to active participants whose responses and reactions can even change the direction of the activity. Therefore, we came up with a hands-on activity for a “pop-up” test researching the course page layout of data visualization tool, Academic Reporting Tools 2.0 (ART 2.0).
Using “pop-up” tests to inform layouts that make the most sense for students
ART 2.0 helps students, faculty, and staff make more informed decisions by providing access to, and analysis of, U-M course and academic program data. By allowing students and faculty to access data on courses and majors from past academic terms, ART 2.0 allows for data-driven information to lead toward better decision making and new opportunities at U-M. With this tool, students can decide what major other students like them pursue and what courses they could consider taking the following semester. A lot of students report they like to use it with Wolverine Access to backpack courses.

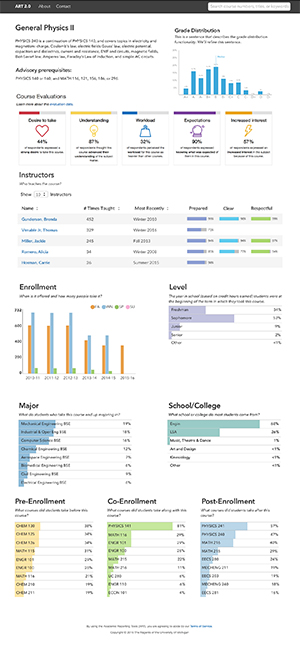
Although ART 2.0 is already an established website (see Figure 2), we still want to learn what is an optimal layout of information for student users. I proposed an alternative, hands-on activity to engage student participants instead of a traditional Q&A format for gathering user feedback. To accomplish this, we took the website and created a form board with the information displayed on the page separated into small components. We put Velcro on the back of these components so students could combine and move around the these pieces until they reached the kind of layout that made the most sense for them (see Figure 3). By offering this hands-on activity, it is easier to assess intrinsic factors, like curiosity, instead of only extrinsic factors, such as treats or rewards, in their decision making process. It is also a “free of fail” activity for participants since we know that different people have different preferences in comparison to a Q&A format, where participants may be embarrassed by not knowing the correct answer to a question.
As we expected, there were no two identical answers out of the 30 samples we collected. Some students preferred a more concise layout and others proposed to combine similar groups of information, for example pre-enrollment, co-enrollment and post-enrollment, for a particular class. From there, we assigned different scores to different areas of the board (upper, middle lower). Components that were placed in the upper section received three points, the middle section received two points, the lower section received one point, and all others received zero points. With this strategy, and our experience interacting with participants, we are able to identify some general patterns:
- The top three factors students take into consideration when deciding on a course are grade distribution, instructor reviews, and student evaluations.
- Graduate students pay less attention to school, major, enrollment trends, and grade distribution because they have fewer instructors to choose from.
- Different schools/colleges also have their own way of collecting course evaluation, and students wish to see more information that is tailored to their own school/college.
During this first round of hands-on, “pop-up” usability testing, we were able to gather valuable feedback while identifying a process that we could keep improving upon. We are confident in the advantages of a substantial user pool and in the feedback collected locally by U-M students. Through this process, we hope Academic Innovation will keep creating and improving tools that best serve students.


